Date published: 2015-01-07
Measuring Linearity, Readout Noise and Gain of a ATIK383L+ CCD camera
Today I did some tests with my 2-year old ATIK383L+ CCD camera. I am using the camera regularly and you can find some results at my astrophotography page. The camera uses the well-known KAF-8300 17.6mmx13.52m CCD chip with a resolution of 3362×2504 pixels and a pixel size of 5.40µmx5.40µm. The manufacturer promotes it as a camera with very low read-noise of 7electrons, great linearity and with ideal Gaussian shaped bias frames.
So let’s see if that is true for my model.
Linearity
This is the easiest of the performed tests. Thereby the camera was mounted on the focuser of my telescope and the aperture was illuminated with my Flatfield panel. Then several images were taken with increasing exposure times as seen in the table below. Subsequently, the so gained flatfields were corrected for bias and darkcurrent contributions. The resulting mean counts in each individual image were tabulated and plotted against the exposure times showing the linearity of the CCD.
| Exp Time [s] | ADU | Poisson Error [%] | Fit 1 Error [%] | Fit2 Error [%] | Fit3 Error [%] | Fit4 Error [%] |
| 1 | 650 | 3,92 | 135,0 | |||
| 2 | 1222 | 2,86 | 61,7 | |||
| 3 | 1598 | 2,50 | 51,8 | |||
| 4 | 2108 | 2,18 | 36,4 | |||
| 5 | 2611 | 1,96 | 27,4 | |||
| 6 | 3106 | 1,79 | 21,5 | |||
| 8 | 4111 | 1,56 | 13,7 | 15,8 | ||
| 10 | 5098 | 1,40 | 9,3 | 11,3 | ||
| 14 | 7073 | 1,19 | 4,2 | 6,1 | ||
| 18 | 9045 | 1,05 | 1,4 | 3,2 | 7,3 | |
| 22 | 11009 | 0,95 | 0,4 | 1,4 | 4,6 | |
| 28 | 13911 | 0,85 | 1,8 | 0,0 | 2,3 | 4,1 |
| 36 | 17771 | 0,75 | 2,9 | 1,2 | 0,5 | 1,8 |
| 44 | 21635 | 0,68 | 3,6 | 1,9 | 0,7 | 0,2 |
| 52 | 25353 | 0,63 | 3,5 | 1,8 | 1,0 | 0,2 |
| 60 | 29083 | 0,59 | 3,5 | 1,9 | 1,3 | 0,6 |
| 70 | 33737 | 0,54 | 3,5 | 1,8 | 1,5 | 1,0 |
| 80 | 38357 | 0,51 | 3,4 | 1,7 | 1,5 | 1,1 |
| 90 | 42887 | 0,48 | 3,1 | 1,5 | 1,4 | 1,1 |
| 95 | 45068 | 0,47 | 2,8 | 1,1 | 1,1 | 0,9 |
| 100 | 47214 | 0,46 | 2,5 | 0,8 | 0,8 | 0,6 |
| 105 | 49310 | 0,45 | 2,1 | 0,4 | 0,4 | 0,2 |
| 110 | 51431 | 0,44 | 1,7 | 0,0 | 0,2 | 0,0 |
| 115 | 53484 | 0,43 | 1,3 | 0,4 | 0,2 | 0,4 |
| 120 | 55549 | 0,42 | 0,9 | 0,8 | 0,6 | 0,7 |
| 125 | 57491 | 0,42 | 0,4 | 1,4 | 1,1 | 1,2 |
| 130 | 59456 | 0,41 | 0,1 | 1,9 | 1,6 | |
| 150 | 61486 | 0,40 | 11,4 | |||
| <error> [%] | 14,70 | 2,68 | 1,56 | 0,95 |
A Linear regression was performed iteratively narrowing down the count range (ADU) in order to find typical errors introduced due to non-linearity of the CCD. A fit to all data points (red) gives a poor result, as expected, with a typical error of roughly 15 percent (see last row in table above). When limiting the range to values above 1000 ADU and below 60000 ADU a correlation coefficient R of 0.9996 (orange data; note that the value in the plot is R2) is found, which is still worse than the number given by the manufacturer (0.9998). Thus, I definitely cannot recommend doing photometry within the full range of 1000 to 64000 ADU as suggested on the ATIK website. Nevertheless, the linearity seems to be good within a range of 10000 to 60000 ADU (yellow). In that range typical errors are below 2 percent only. The best performance is found between 15000 ADU and 55000 ADU, which is the range I would consider as the photometric one.
Thus, highest photometric precision is possible for countrates above 15000 ADU and below 55000 ADU.
Gain Measurement
There are several methods available to measure the gain. I have chosen the method described by Michael Richmond. So the following steps were performed:
1) a pair of L-flats was taken with varying exposure times (2,4,8,16,32,64 sec)
2) a set of 3 dark frames with the same exposure time was taken
3) individual darks were combined using the average value (masterdarks)
4) masterdarks were subtracted from the appropriate flats
5) sum of each pair of flats was calculated and devided by 2: sum*.fits
6) difference of each pair of flats was calculated: diff*.fits
7) gain is the inverse of the slope of the plot: mean vs. variance, where the variance is: RMS2/2.
| IMAGE | Mean | IMAGE | RMS | Variance | |
| sum2.fits | 1524 | diff2.fits | 89.0 | 3957.8 | |
| sum4.fits | 2747 | diff4.fits | 114.1 | 6509.4 | |
| sum8.fits | 5516 | diff8.fits | 159.5 | 12720.1 | |
| sum16.fits | 10975 | diff16.fits | 218.5 | 23871.1 | |
| sum32.fits | 21841 | diff32.fits | 306.0 | 46818.0 | |
| sum64.fits | 43342 | diff64.fits | 426.4 | 90908.5 |
The gain is then the inverse of the slope when doing a linear regression of the mean vs. variance plot.
A gain of 0.48 e–/ADU was found for the ATIK383L+.
Readout-Noise
In order to measure the readout-noise of the CCD camera, bias frames taken throughout several hours of observations were used. The readnoise was measured following the procedure described here:
1) 9 bias frames were taken and combined using the median (masterbias)
2) the masterbias was subtracted from each individual bias: Rdnoise*.fits
3) readnoise is the standard deviation in these images (see table)
4) finally the masterbias was analysed using the histogram and a Fast Fourier Transform (FFT)
| IMAGE | NPIX | MEAN | STDDEV | MIN | MAX |
| Rdnoise1.fits | 8529394 | 0,6629 | 19,56 | -124,5 | 1885 |
| Rdnoise2.fits | 8529394 | 3,382 | 19,84 | -123,5 | 1046 |
| Rdnoise3.fits | 8529394 | -2,212 | 19,49 | -262 | 644 |
| Rdnoise4.fits | 8529394 | -1,562 | 19,57 | -129 | 5063 |
| RdnoiseB1.fits | 8529394 | -0,4971 | 20,17 | -118 | 9360 |
| RdnoiseB2.fits | 8529394 | -0,7299 | 19,89 | -122 | 518 |
| RdnoiseB3.fits | 8529394 | 0,8872 | 19,95 | -163 | 426 |
| RdnoiseB4.fits | 8529394 | -0,467 | 19,89 | -114 | 523 |
| RdnoiseB5.fits | 8529394 | 1,106 | 19,95 | -116 | 709 |
I noticed that the bias-level can vary slightly (order of 20 ADU) during several hours of observations. Therefore, it is the best to keep track on the bias level and take some bias once an hour. For this test, I had to create two individual masterbias frames in order to extract the correct readout-noise. The result is not affected by that.
The average value of the readout-noise for my ATIK383L+ is: 19.8 ADU. Using the gain calculated before, a readnoise of 10 electrons was measured.
Thus, the level of the readout-noise is indeed very low with only 10 e–. However, it is not as low as promoted by the manufacturer.
In a next step, the quality and homogeneity of the masterbias was examined using the histogram and a FFT (see below).
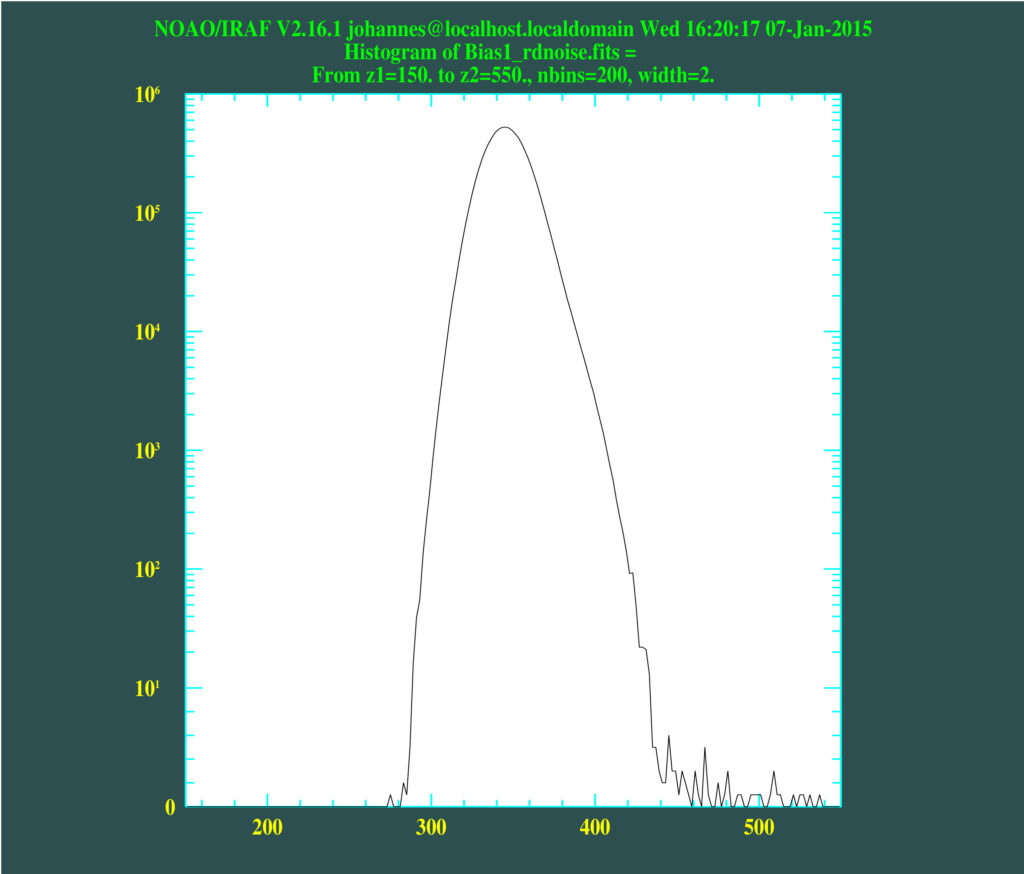
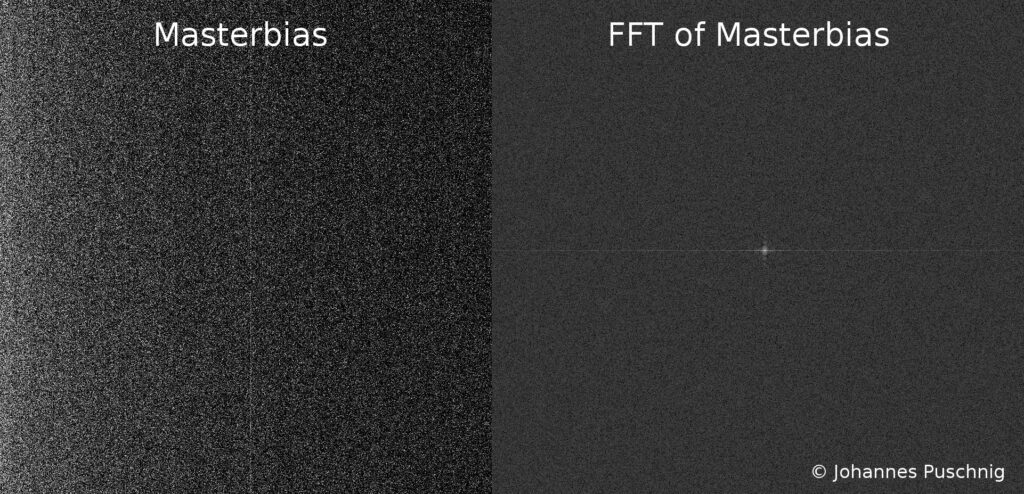
An examination of the historgram reveals that the bias is of course not an ideal Gaussian as promoted by the manufacturer. However, it is Gaussian-like and thus noise dominated. Furthermore, a column of increased bias level can be identified in the image and after performing a Fourier Transform, it can be seen that some non-random pattern exists. This is indicated by the “cross” in the middle of the FFT image. However, the relative value of the pattern is very low.
I would conclude that the camera’s bias indeed is noise-dominated and very smooth, certainly allowing for faint details to be detected.
Finally the performed measurements show that the ATIK383L+ is a CCD camera that can be used for scientific photometric applications when limiting the linearity range as suggested. Due to its smooth bias it is furthermore an excellent tool for high quality astrophotography.